Update time: June 14, 2025
If you’ve opened GA4’s DebugView recently and noticed way more debug devices than you expected — sometimes even hundreds: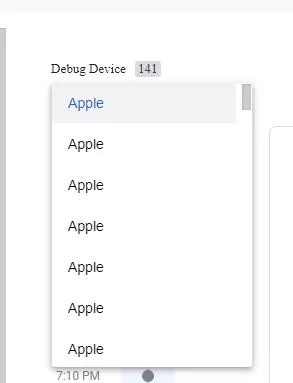
You’re not alone. I’ve seen this question pop up more and more, and the answer is almost always the same.
The good news? It’s not a bug, and your tracking isn’t broken. The cause is simple, and the fix takes about 30 minutes.
What Actually Happens
DebugView is designed to show you events from devices that are in debug mode — typically your own device while testing in GTM Preview mode.
But if DebugView is flooded with devices that aren’t yours, there’s one likely cause:
You accidentally published debug_mode to your production GTM container.
Here’s how it happens. In your GA4 event tags in GTM, there’s a field called Fields to Set. One common setting people add is debug_mode: true. This tells GA4 to treat events as debug events, which makes them show up in DebugView.
You test this in your development workspace — it works great. Then you publish to production without removing debug_mode. Now every user who triggers that tag sends debug events. And DebugView shows all of them.
The Fix
Open each GA4 tag in GTM. Check Fields to Set for debug_mode.
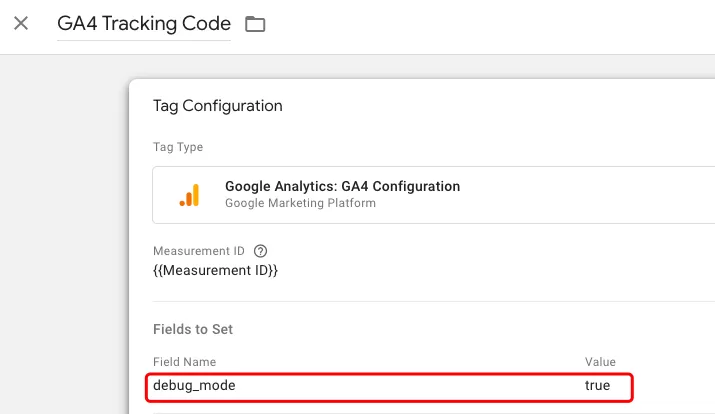
If it’s there, remove it, save, and publish a new version. Wait about 30 minutes for the excess devices to clear.
How to Prevent It
Before publishing to production, scan your GA4 tags for debug_mode. I’ve made this mistake myself — it’s easy to forget.
One approach I’ve found useful: keep a separate workspace for debugging. That way debug settings never end up in production tags.
Final Words
Too many debug devices in DebugView almost always means debug_mode was published to production. Remove it, republish, and you’re good.