Updated: December 19, 2025
If you’ve ever looked at your GA4 reports and wondered, “Is this good? Are we doing better or worse than other sites like ours?” — you’re not alone. That’s exactly the question benchmarking is meant to answer.
GA4 recently introduced Benchmarking, a feature that lets you compare your property’s performance against peers in the same industry category. In this guide, I’ll walk you through everything you need to know — what it is, how to enable it, and how to make sense of the data.
Let’s get into it.
What Is Benchmarking in GA4?
Benchmarking in GA4 lets you compare your property’s key metrics against other properties in the same industry. The idea is simple: instead of guessing whether your engagement rate or bounce rate is normal, you can see how you stack up against your peers.
Peers are determined by the industry category you selected when setting up your GA4 property. If you chose “E-commerce / Retail,” for example, you’ll be compared against other properties in that same category.
Think of it as a reality check for your analytics data.
Rules You Should Know
Before you jump in, there are a few ground rules worth understanding:
- Minimum thresholds — Your property needs enough traffic and meaningful data to be included in a peer group and contribute to benchmarking metrics. Low-traffic properties won’t qualify.
- Data refreshes every 24 hours — Benchmarking data isn’t real-time. It updates once a day.
- Data available starting May 30, 2024 — You won’t see historical benchmarking data before this date.
How to Enable Benchmarking
Benchmarking isn’t turned on by default. You need to opt in.
In GA4, click「Admin」——「Account Settings」——「Account」——「Account Details」, and check “Modeling contributions & business insights” to enable benchmarking:
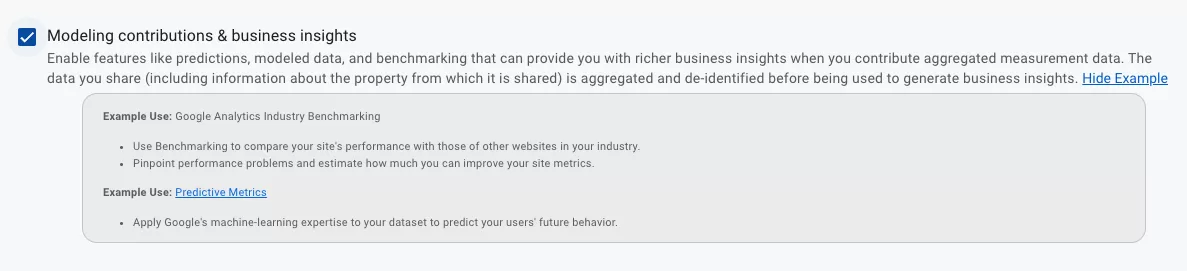
That’s it. Once enabled, GA4 will start including your anonymized data in the peer group calculations and, in return, show you benchmarking data.
How to View the Benchmark Report
Once benchmarking is enabled, you can access the report directly from the GA4 home screen.
Click「Home」 in GA4, look for the Overview card — it contains a Benchmark Report button.
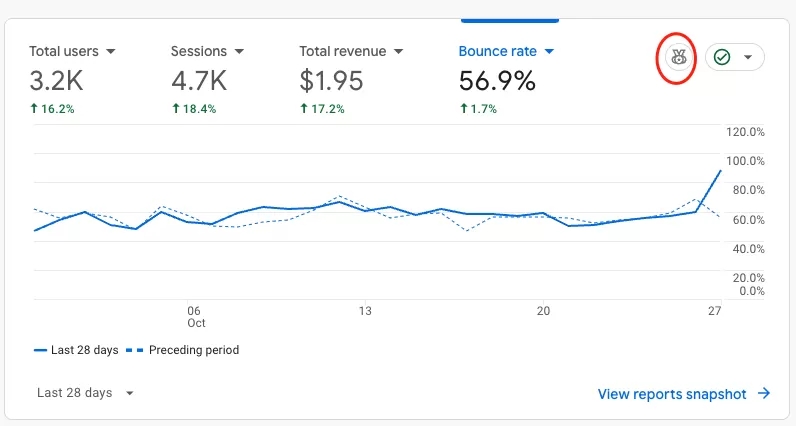
Click that button, and you’ll see the benchmark report with three key visual elements:
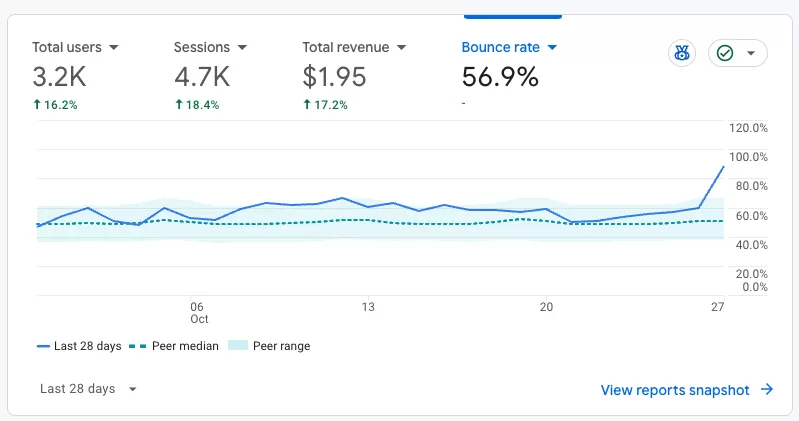
- Your property’s trendline (solid line) — this is your actual performance over time.
- Median in your peer group (dotted line) — the middle value among your peers.
- Range in your peer group (shaded area) — this represents the 25th to 75th percentile. If you’re above the shaded band, you’re outperforming most of your peers. Below it? There’s room to improve.
Benchmarking Metrics
Not every metric in GA4 is available for benchmarking. Google has selected a focused set organized into four categories:
- Acquisition
- New user rate
- Engagement
- Retention
- Monetization
- Add to carts per user
- Average revenue per user (ARPU)
- Average revenue per paying user (ARPPU)
- Average purchase revenue per user
- Checkouts per user
- First-time purchaser rate (FTP rate)
- First-time purchasers per new user
- Paying monthly active users / Daily active users (PMAU / DAU)
- Paying weekly active users / Daily active users (PWAU / DAU)
- Total ad revenue per user
- Transactions per purchaser
- Transactions per user
That’s a solid set of metrics to work with. If you’re an e-commerce site, the monetization benchmarks are especially useful.
How to Change Your Peer Group
Your peer group is based on the industry category you picked during property creation, but you’re not stuck with it. You can change it in two ways:
Method 1 — Via Property Settings
Click「Admin」——「Property Settings」——「Property」——「Property Details」,and update the Industry category field.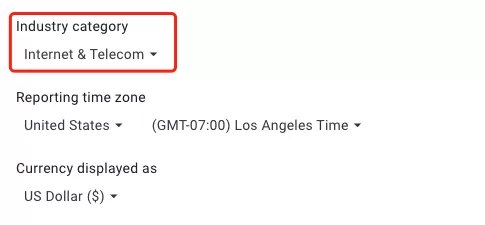
Method 2 — Directly from the Benchmark Report
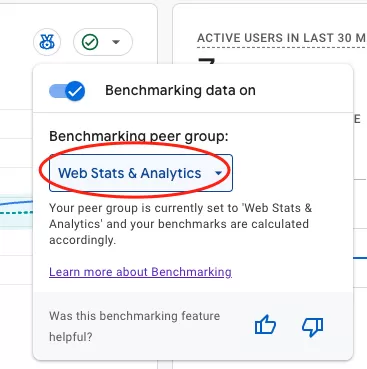
Click the Benchmarking icon on the Overview card, then edit the Benchmarking peer group directly. This method is faster if you just want to experiment with different peer groups.
Final Words
GA4 Benchmarking is a useful addition if you’ve ever wanted context around your analytics numbers. Instead of looking at your metrics in isolation, you can now see whether your engagement rate is above or below the industry median, and how far off the mark you are.
Is it perfect? Not quite. The peer group is only as good as the industry category you chose, and the minimum threshold means small sites won’t qualify. But for most businesses with decent traffic, it’s a solid tool for understanding where you stand.