Updated: May 27, 2026
If you’ve been looking for Bounce Rate in GA4 and couldn’t find it in the default reports, you’re not alone. GA4 didn’t launch with Bounce Rate as a first-class metric — it was added later because users kept asking for it. But here’s the thing: it doesn’t work the same way it did in Universal Analytics.
In this article, I’ll explain what Bounce Rate means in GA4, how it connects to Engagement Rate, and where to actually find it.
What is Engagement Rate in GA4?
Engagement Rate is the percentage of sessions that qualify as “engaged sessions.” That’s the primary metric GA4 pushes, and here’s the formula:
Engagement Rate = Engaged Session/Sessions
A session counts as engaged if it meets at least one of these three conditions:
- Lasts longer than 10 seconds
- Triggers a key event
- Has at least 2 pageviews or screenviews
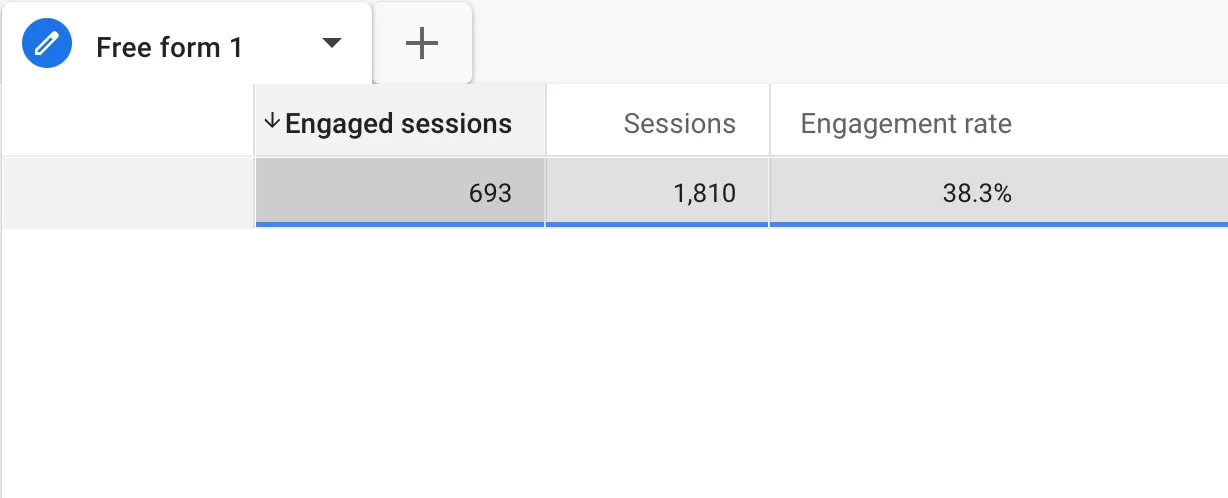
Let’s say your website recorded 1,810 sessions last week, and 693 of them were engaged. Your Engagement Rate would be roughly 38.3%. That means about 38% of your visitors stuck around or interacted meaningfully.
What is Bounce Rate in GA4?
Bounce Rate is simply the inverse. It measures the percentage of sessions that were not engaged. A session bounces when:
- It lasts less than 10 seconds
- No key events are triggered
- Only one page or screen is viewed
The formula is:
Bounce Rate = 1- Engagement Rate
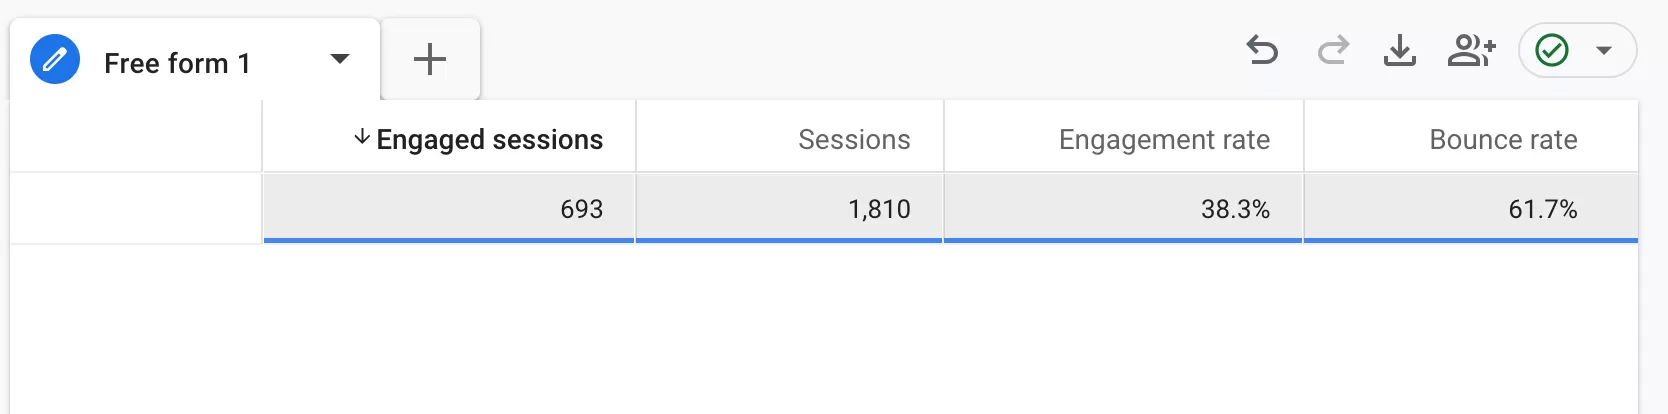
Using the same numbers: if Engagement Rate is 38.3%, your Bounce Rate is 61.7%.
How to View Bounce Rate in GA4
In GA4, Bounce Rate is not displayed in some standard reports by default. However, you can easily add it to your reports or analyze it in Explorations.
Method 1: View Bounce Rate in Reports
Let’s start with the standard Traffic acquisition report.
In GA4, go to:「Reports」——「Traffic acquisition」,This report shows how users arrive at your site by channel — Organic Search, Direct, Paid Search, and so on:
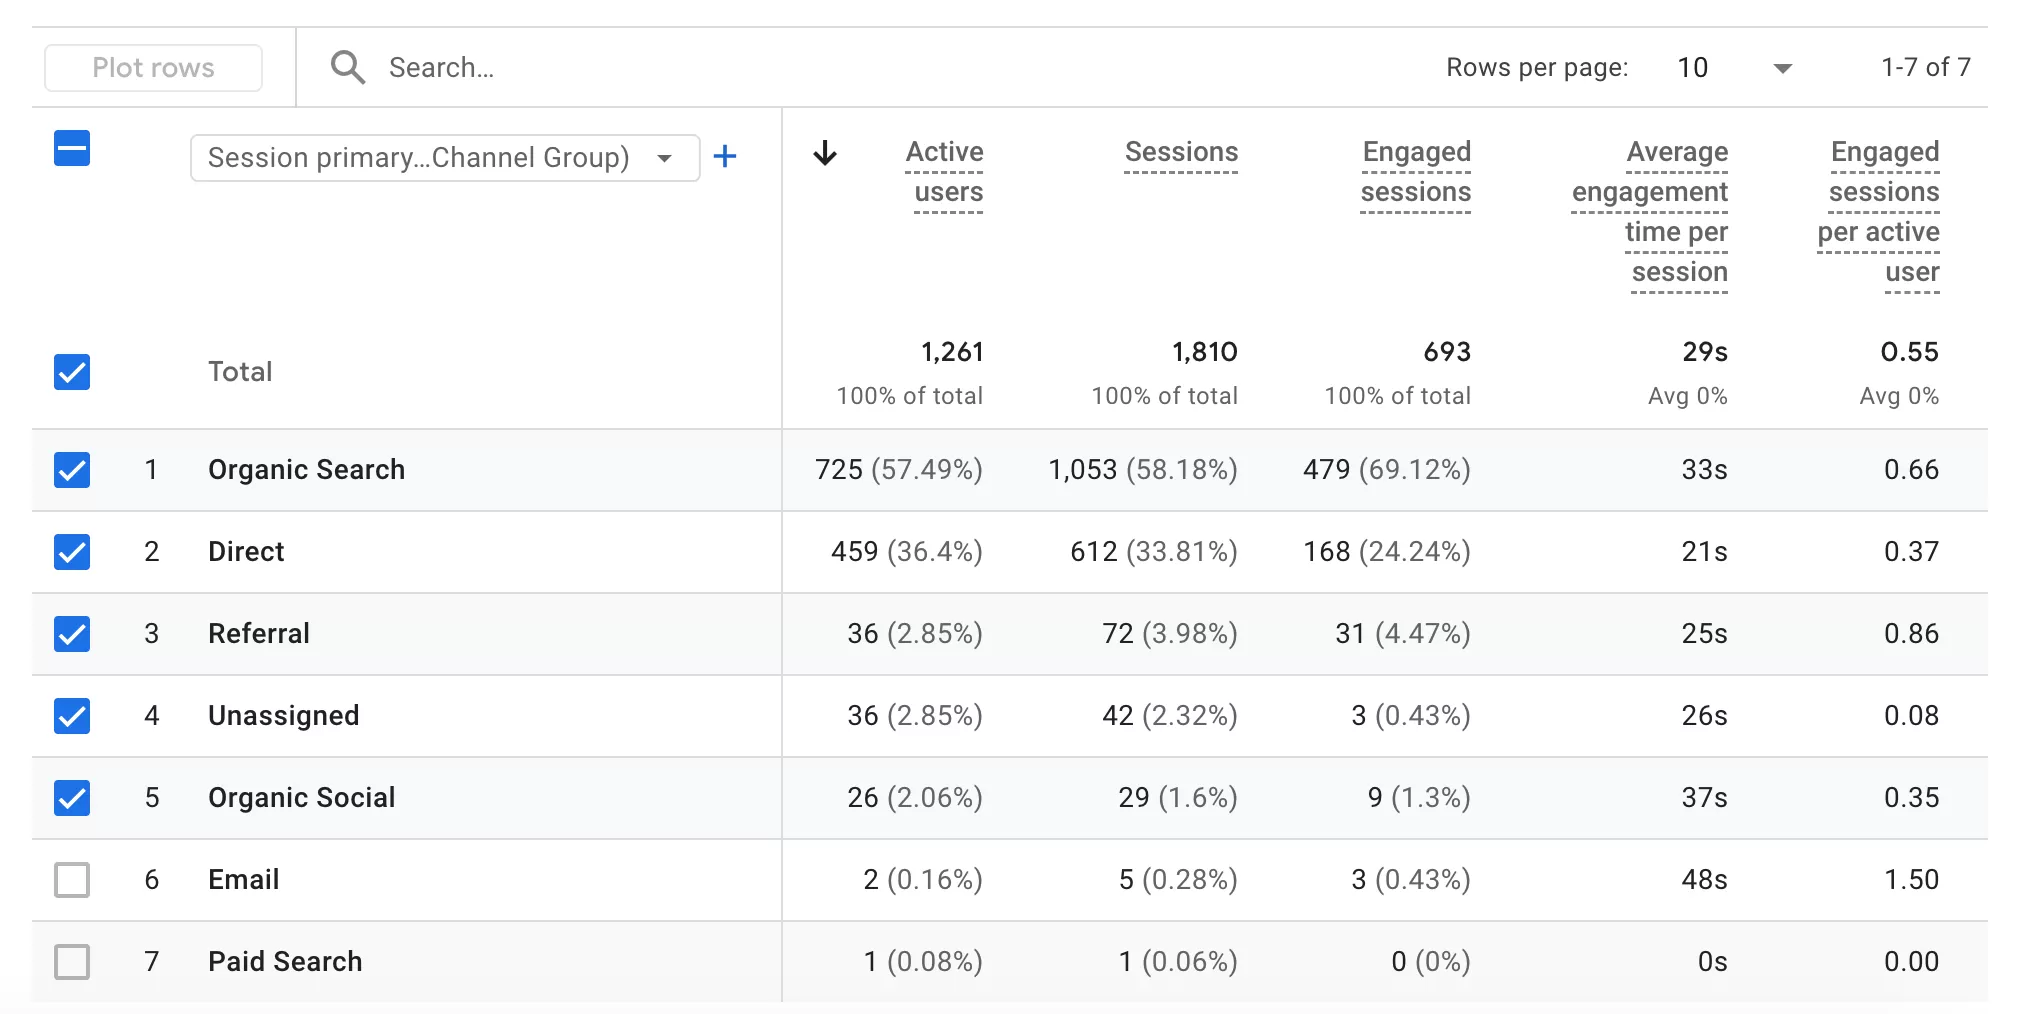
Here’s how to add Bounce Rate:
Step 1: Click the 「Customize Report」 button in the upper-right corner of the report.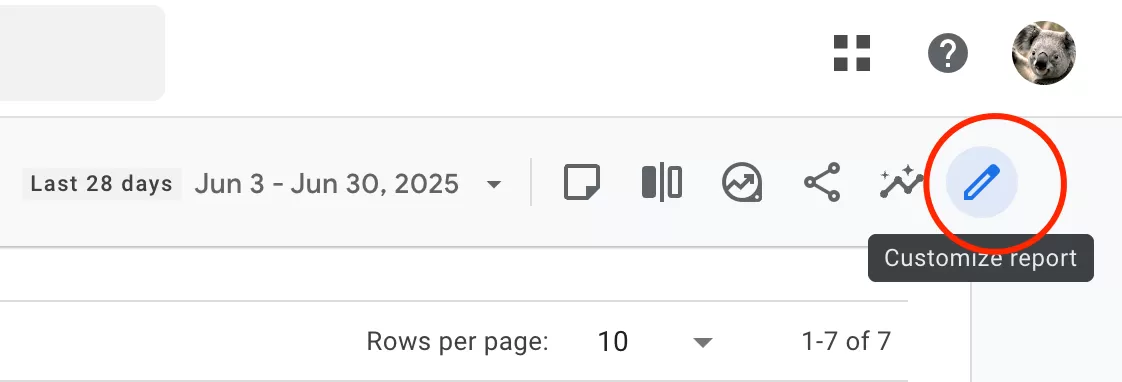
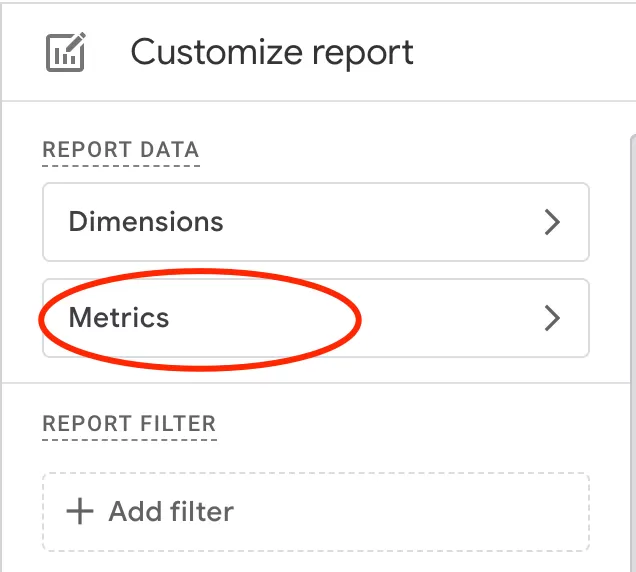
Step 2: Click「Metrics」:
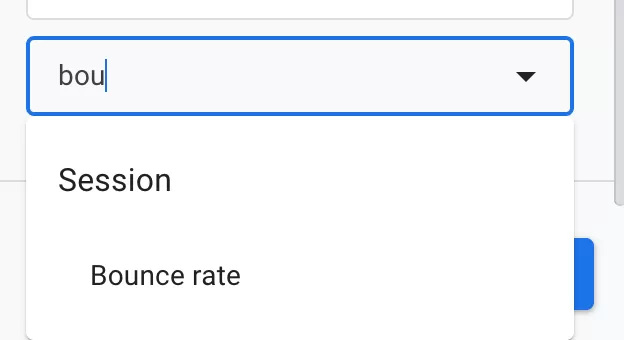
Step 3: In the Add metrics field, search for and select Bounce Rate.
Step 4: click「Apply」——「Save」——「Save changes to current report 」:
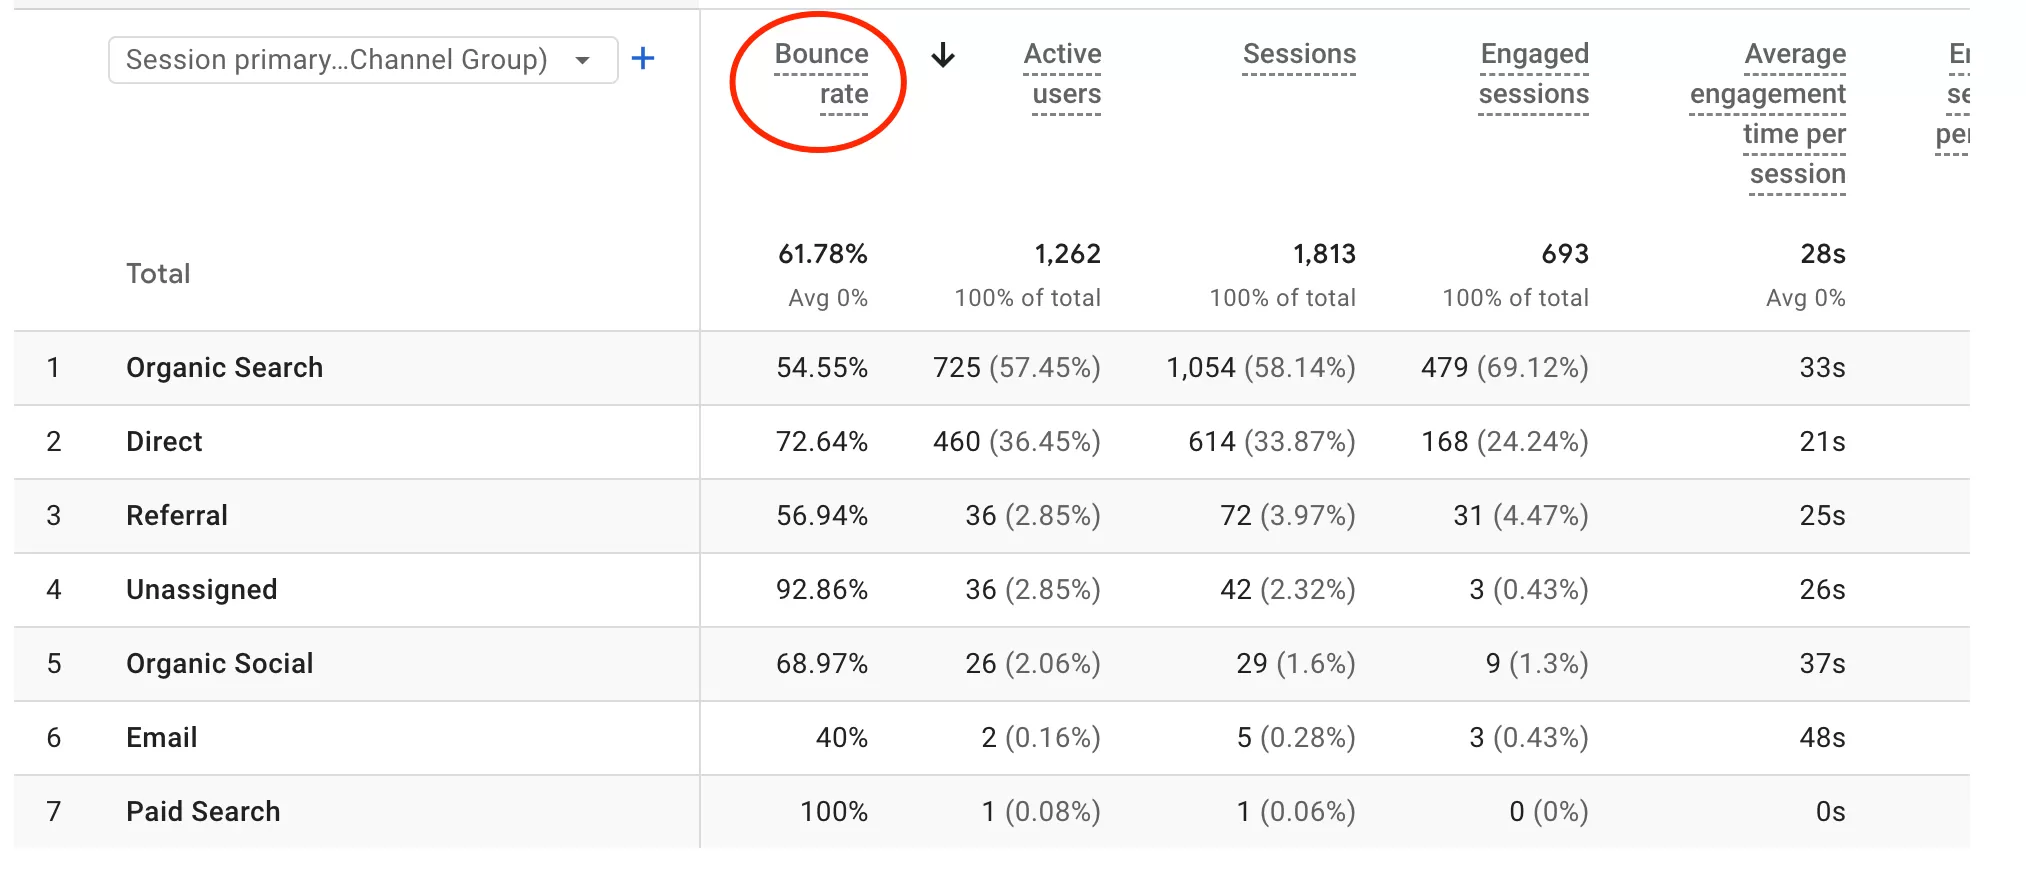
That’s it. The report now shows Bounce Rate alongside your other acquisition metrics.
Method 2: View Bounce Rate in Explore
If you want more flexibility, use the Explore section instead. This gives you more control over dimensions and segments.
Select「Free form」in Explore and configure it like this:
- ROWS:Session default channel group
- VALUES:Bounce rate
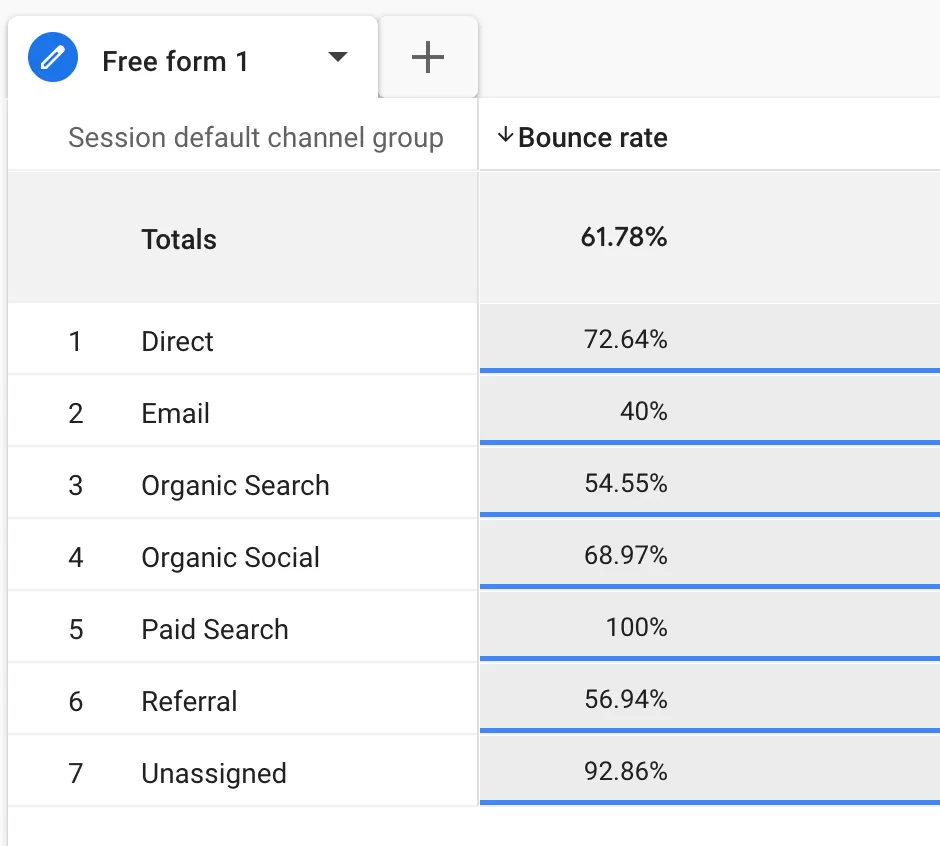
The table will display the bounce rate for each traffic channel. You can swap out the dimension rows for whatever you need — landing page, device category, country, you name it.