If you’re trying to measure how fast your pages load in GA4, you might have noticed something: there’s no built-in dimension or metric for it. GA4 doesn’t track page load time out of the box.
But that doesn’t mean you can’t get it.
If my guess was correct, you have come to the right place. In this article, I’ll walk you through a practical, no-nonsense way to track page load time in GA4 — without inflating your event count.
There are two ways to track page load time in GA4:
- Option 1: Send a separate event. Fire a dedicated event (e.g.,
page_load) after the page finishes loading. This works, but it doubles your event count for every pageview. - Option 2: Add load time to your existing page_view event. Use a custom JavaScript variable to grab the load time from the browser’s Performance API, then pass it as an event parameter alongside the standard
page_view. No extra events, no extra cost.
This article focuses on Option 2 — because why send two events when one will do the job?
Before we start: two things to get right
I’ve seen people trip over the same two issues when setting this up. Getting these wrong means either missing data or messing up your attribution.
The trigger must be Window Loaded, not Page View
If you use the default Page View trigger, the tag fires before the browser has finished loading all resources. At that point, the Performance API hasn’t recorded the full load time yet — so your parameter will be empty (or wrong).
Use Window Loaded as your trigger instead. By then, the browser has everything it needs to report an accurate load time.
Don’t fire the tag before the window is loaded.
This might sound obvious after point #1, but there’s a subtle issue: if your tag fires after the default page_view (because you changed the trigger), GA4 will attribute the event to the next page, not the current one. I’ll show you how to avoid that below.
How to set it up in Google Tag Manager
Ready? Let’s start.
Step 1: Create a Custom JavaScript variable
This variable grabs the page load time using the browser’s Performance API.
In GTM, click「 Variables」——「New」——「Choose a variable type to begin setup…」——「Custom JavaScript 」, and paste the following:
Name the variable something like Page Load Time — you’ll use it in the next step, the effect after setting:
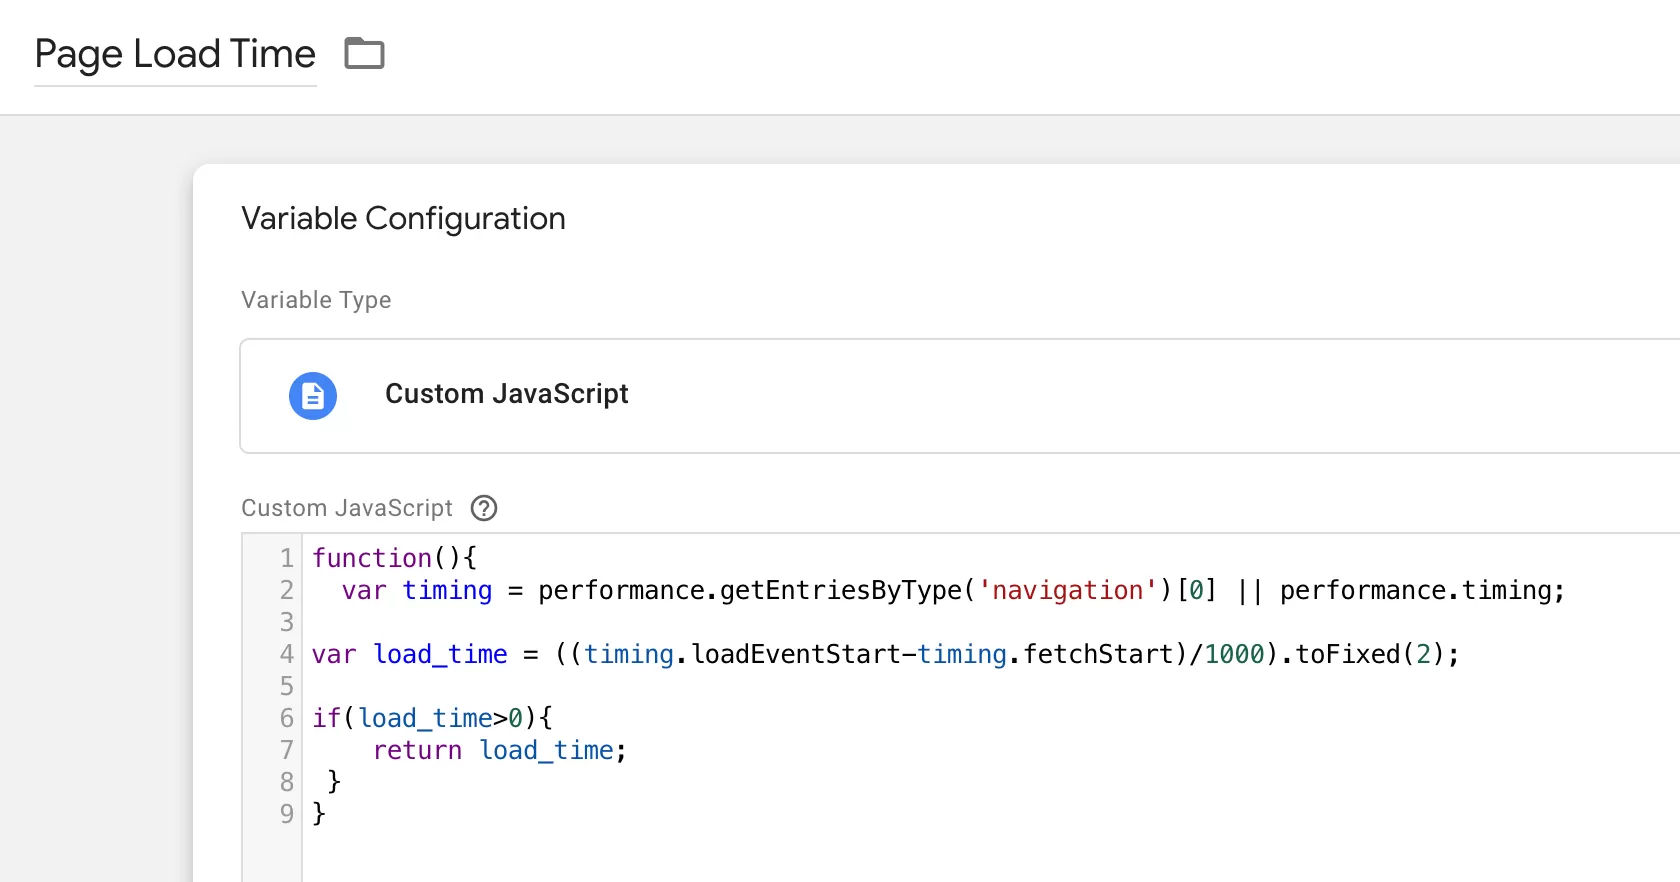
What it does: it calculates the time from the start of the navigation (fetchStart) to when the page fully finished loading (loadEventStart), converts it to seconds, and rounds it to two decimal places. The if (load_time > 0) check prevents the variable from firing before valid timing data is available.
Step 2: Add the Parameter to Your GA4 Tag
Find your existing GA4 configuration tag (the one that sends page_view). Under Shared event settings, add a new event parameter:
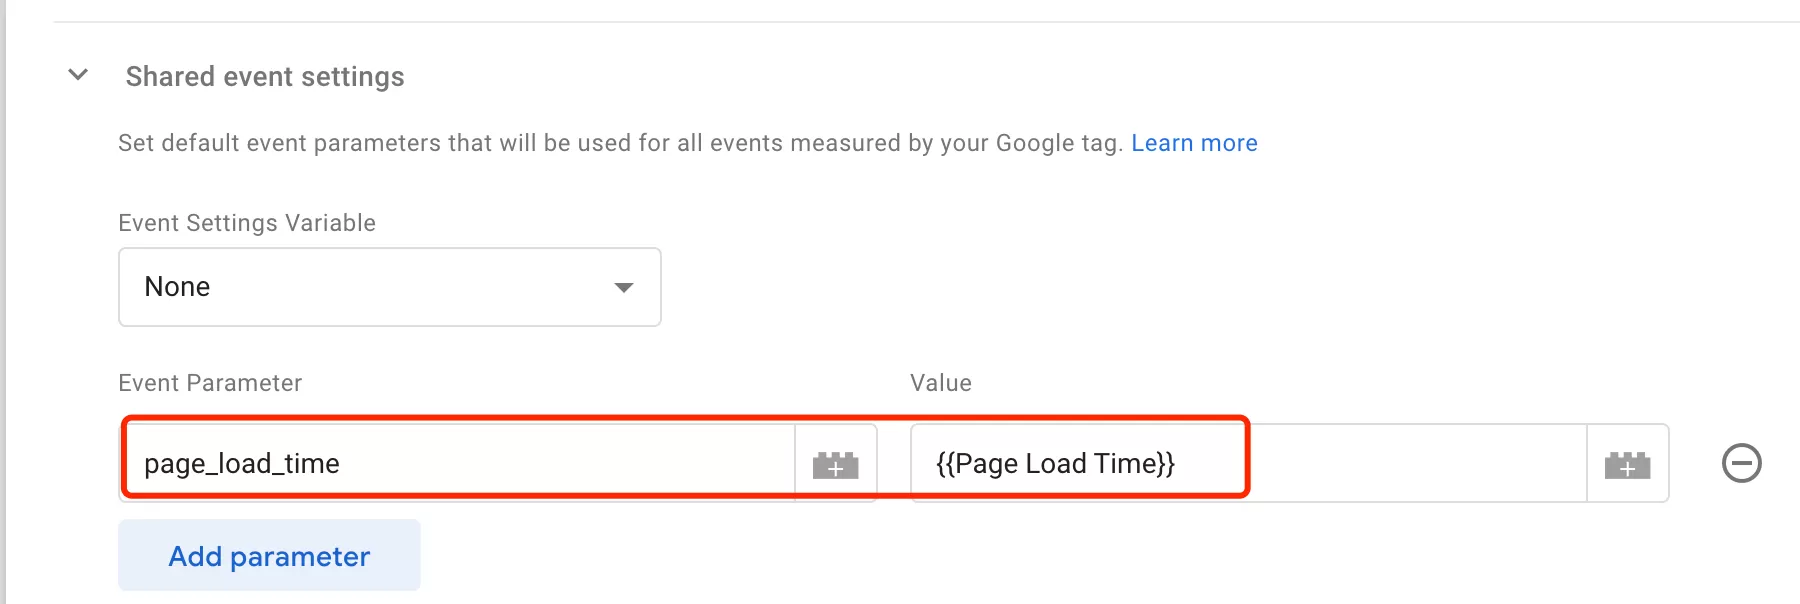
This is where the custom variable feeds the load time into the event.
Step 3: Change the Trigger to Window Loaded
Here’s the critical part. In the same GA4 tag, change the trigger from the default All Pages (which fires on Page View) to Window Loaded
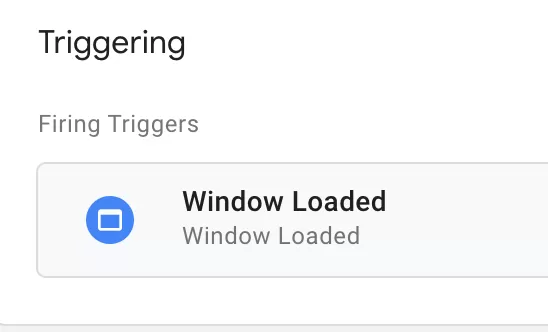
This ensures the tag fires only after the page — and all its resources — have fully loaded, giving the Performance API accurate data.
Step 4: Preview and Debug
Click Preview in GTM and load your website. Open the debug panel and look for the page_view event. You should see the parameter page_load_time with a value like 3.43 (seconds).
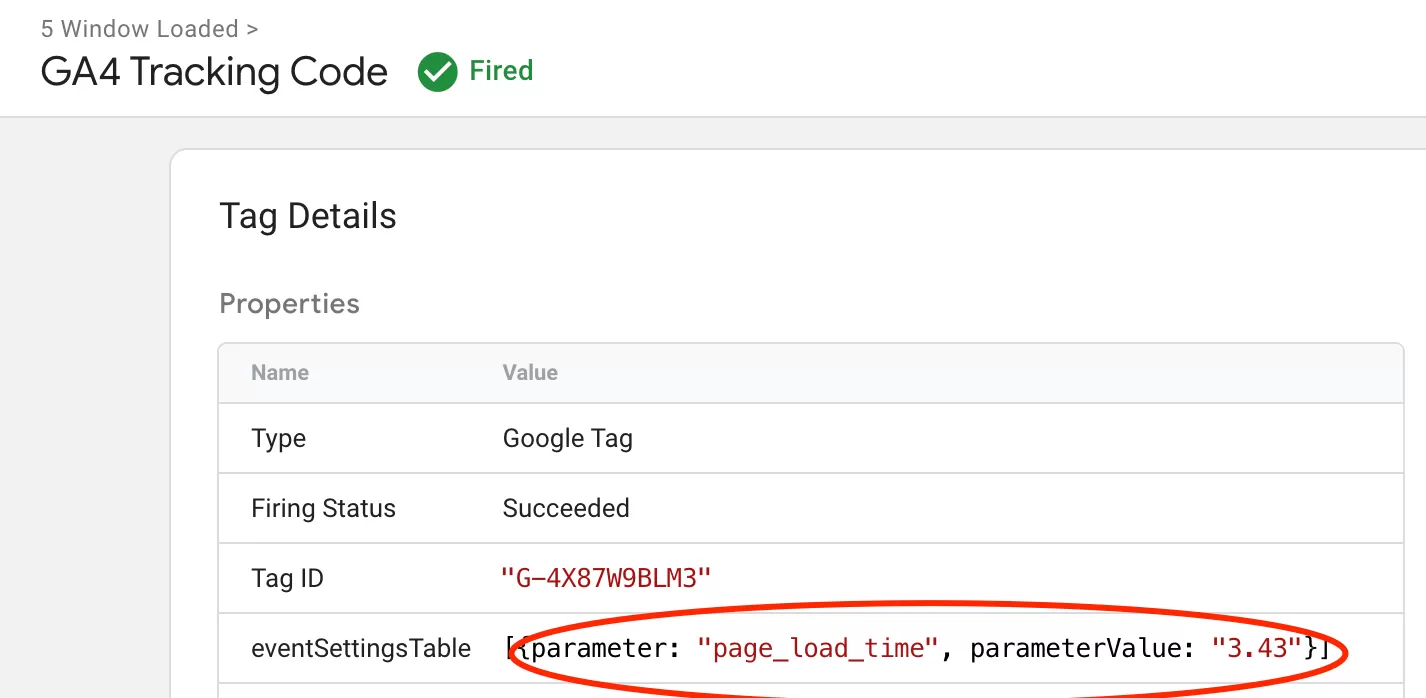
If the parameter is missing, the most likely culprit is the trigger firing too early. Double-check that you’re using the Window Loaded trigger, not Page View.
Step 5: Register Custom Metrics in GA4
Once the data is flowing, you need to tell GA4 that page_load_time is a metric, you need to register it as an Event-scoped Custom Metrics.
In GA4,click「 「Admin」——「Custom Definitions」——「Custom metrics」——「Create custom metrics」, then do the following configuration:
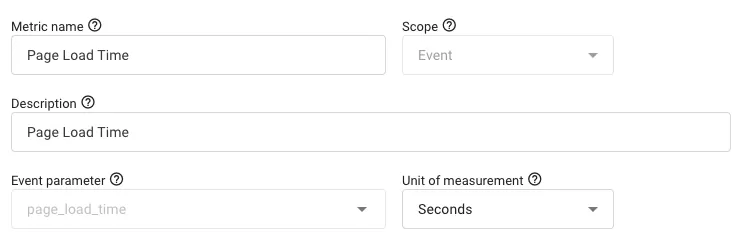
That’s it. Save it, and GA4 will start treating this as an aggregate-able metric.
Step 6 :Verify the Data in Explore
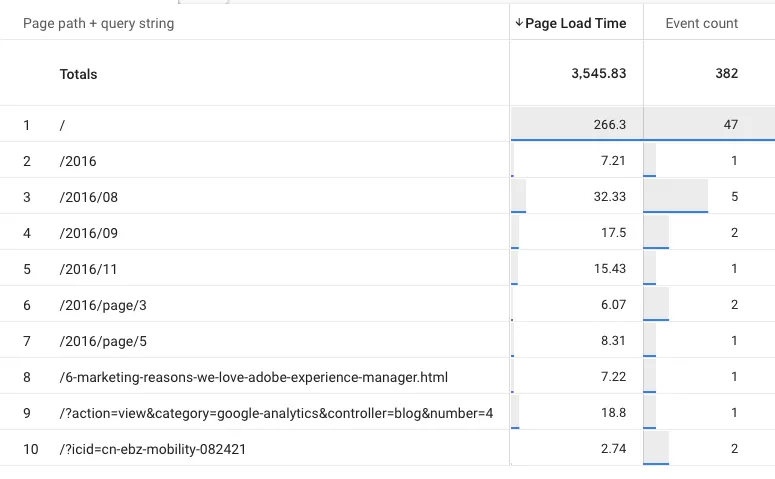
After collecting some data, you can use Free form to verify it in Explorations:
In GA4, click 「Explore」 – 「Free form」,configure the following:
- ROWS: Page path + query string
- VALUES: Page Load Time,Event count
What you’ll see is the sum of load times for each page:
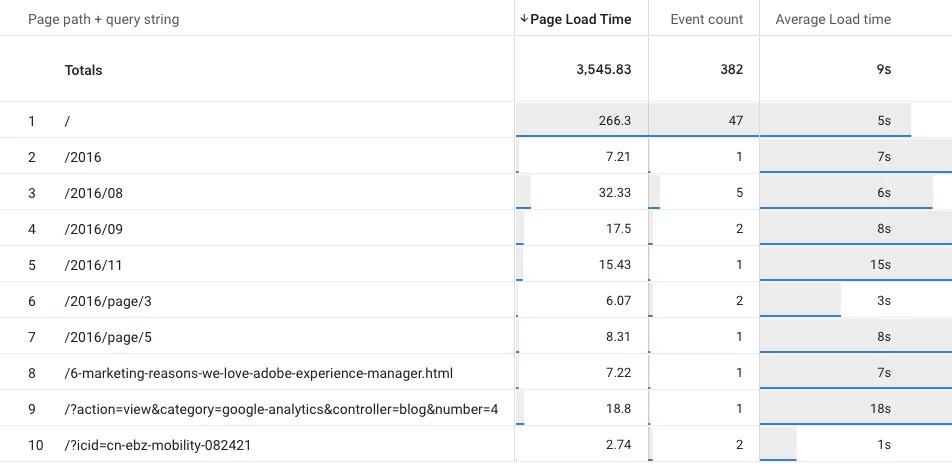
If you want the average load time per page, create a calculated metric:
Formula: {Page Load Time} / {Event count}
The report will then show you the average load time per page — much more useful for performance analysis.
Final Words
Tracking page load time in GA4 takes a bit of setup, but it’s one of those things that pays for itself the first time you spot a slow page you didn’t know about. The method I showed you — adding load time as a parameter to the existing page_view — keeps things clean, doesn’t inflate your event count, and gives you a metric you can slice by page, device, country, or anything else.
One thing I should mention: I’ve tested this with the standard Performance API, but there might be edge cases — single-page applications come to mind — where loadEventStart behaves differently. If you’re running an SPA, I’d love to hear how it went in the comments.